You should monitor your Rails application regularly, to find performance bottlenecks. Here are some tools that help you achieve this.
1. Using rack_mini_profiler gem
Install it by adding the gem 'rack_mini_profiler' to your Gemfile. If you append your url with the pp parameter, you will get to see some options for Rack Mini Profiler.
For example, running locally http://localhost:3000/?pp=help - shows the help screen.
Memory Profiling
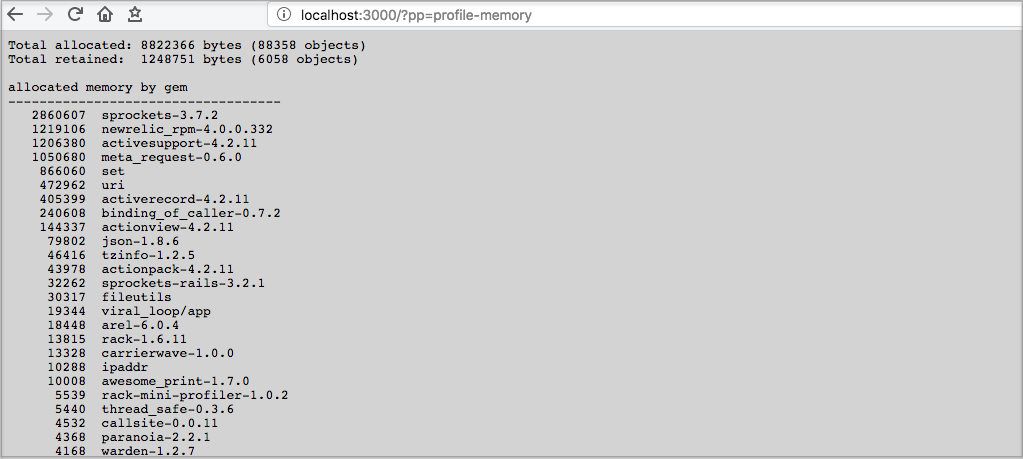
To find which gems and files are using the memory, accesing the url http://localhost:3000/?pp=profile-memory - will show the memory profile.
This requires gem 'memory_profiler' to be added to the Gemfile.

As you can see above, gems like newrelic_rpm, meta_requests etc are adding to the memory consumed by the Rails app; so its important to add them to the right group in the Gemfile.
Flamegraph of the Stack
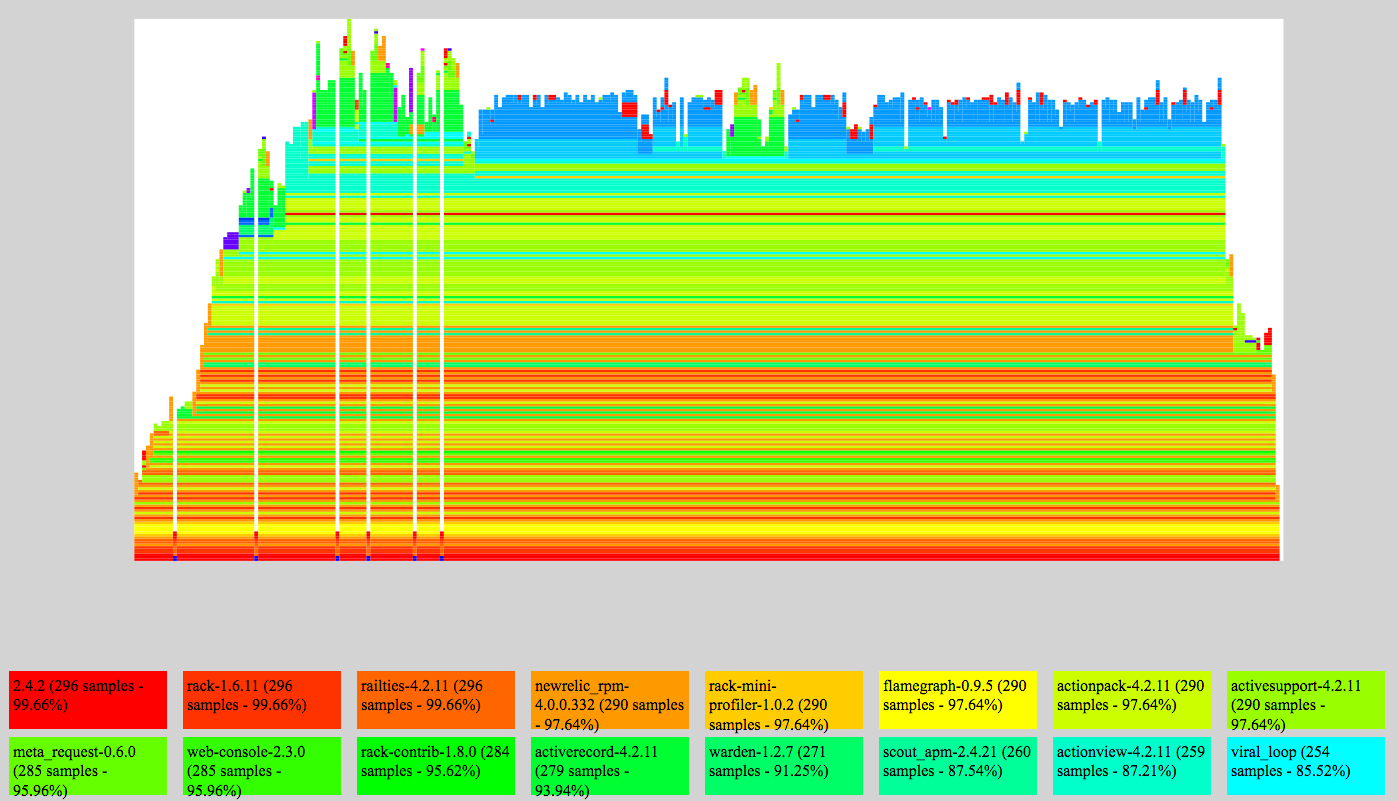
Add the following gems to show the flamegraph of the call stack with rack_mini_profiler.
gem 'flamegraph'
gem 'stackprof'
It can show the flamegraph of the call stack. For more about how to interpret the famegraph read Rails App’s Performance blog post by Justin Weiss.

2. Rails Panel
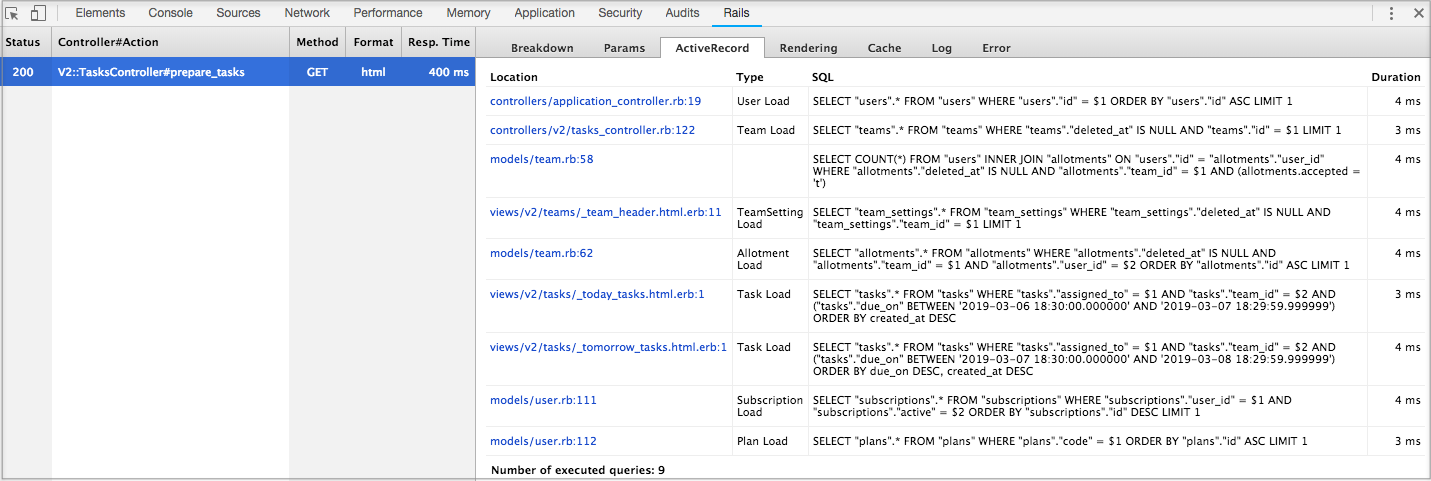
If you are using Google Chrome, there is a handy Chrome extension called Rails Panel. Download it from the chrome web store.
This extension will show you the breakdown of time taken in Rendering, ActiveRecord etc.
The gem 'meta_request' needs to be added to the development group in the Gemfile, for the data to appear in Rails panel.

3. Scout DevTrace
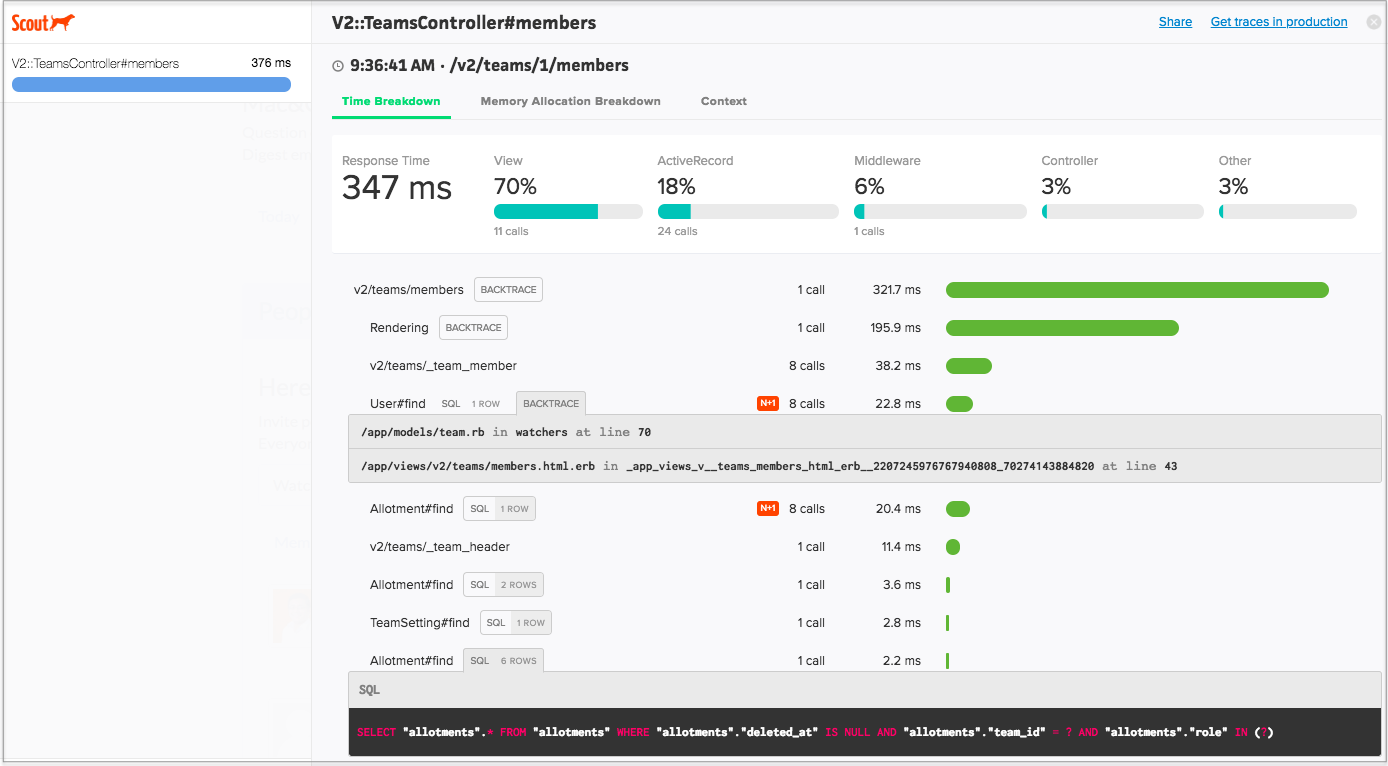
Using the scout agent (add gem 'scout_apm' in the Gemfile) in development mode will show a beautiful panel with the breakdown of time consumed in various sections - Views, Middleware, ActiveRecord, controllers etc. It also shows N+1 queries and backtraces.

You need to start the server with the environment variable SCOUT_DEV_TRACE=true for this.
$ SCOUT_DEV_TRACE=true be rails server
4. Derailed Benchmarks
Derailed Benchmarks gem can be used for a variety of tasks. Well, the gem has packaged common performance into rake tasks. Read the code here - derailed_benchmarks#tasks.rb.
Gem-wise memory consumption
Running the following command will give the list of gems used in the app, along with the memory they consume.
bundle exec derailed bundle:mem
Identify memory leaks
For running memory and stack profilers you need to prepare your app to run in RAILS_ENV=production. The following needs to be taken care of:
- Disable ssl configuration for the test
config.force_ssl = falsein environments/production.rb. Troubleshooting - Read this Gist. - Check database for production and the secrets file.
- Use the same server as you use in production. Derailed by default uses
Rack::Mockby default. - Configure authentication as per the documentation.
Running perf:mem_over_time will boot up the app and show the memory consumed by the app, as its hit by a larger amout of requests.
USE_SERVER=puma bundle exec derailed exec perf:mem_over_time
If the memory remains constant after a point, then the app does not have any memory leaks.
But if the memory keeps increasing, then there is a memory leak. You can debug further by looking at the objects in the memory
bundle exec derailed exec perf:objects

# OR get a Heap Dump
bundle exec derailed exec perf:heap
5. Using fasterer gem
fasterer gem is not exactly a monitoring tool, but it will give suggestions on Ruby speed improvements. This is not Rails specific, but generic Ruby.
 There is also a fast-ruby repo, which has benchmarks of fast and slow Ruby code.
6. Using bullet gem
Eliminating N+1 queries can improve the application speed drastically.
Use the bullet gem to identify and remove N+1 queries.
7. Newrelic Agent
The developer panel of Newrelic has been removed in the newer editons of the gem.
For viewing this an old gem version '~> 4.0.0' has to be used.
gem 'newrelic_rpm', '4.0.0.332'

Credits: Header photo by Markus Spiske on Unsplash.


 Delayed Job as a rake task